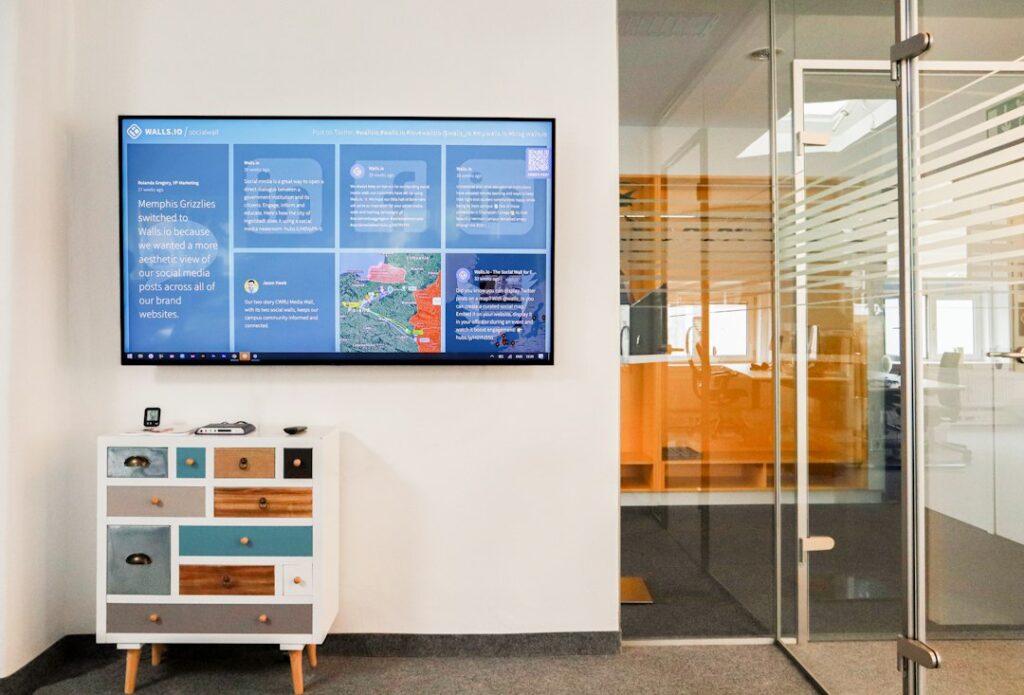
Live Data for Digital Signage: How to Automate Screen Content (2026)
Live data for digital signage means screens that update themselves from the systems you already run: a Power BI dashboard, a Google Sheet, a booking system, a stock feed, a weather service. Instead of someone exporting a chart every Monday and uploading it, the screen pulls the latest numbers on its own. It is the single biggest difference between signage that stays useful and signage that turns into a screensaver.
This guide explains the ways to connect data to screens, from ready-made apps to custom integrations, how rule-based content automation works, what it takes from IT in security and maintenance, and which platforms handle it well. It is written for IT teams and the people who own the content, in offices, factories, retail and hospitality.
Quick verdict
Start with what your signage platform already offers: most business-focused platforms include connectors for Power BI, Google Sheets, calendars, RSS and weather, and those cover the majority of needs. Use a spreadsheet or SharePoint list as the go-between for anything without a connector, because it lets non-developers keep data current. Move to APIs, webhooks or a custom HTML app only when you need real-time updates from an operational system, and treat that as a small software project with an owner.
Who this is for
- IT managers asked to “put the KPIs on the screens” without building a manual process
- Communications and operations teams who are tired of updating slides by hand
- Retail, hospitality and manufacturing teams that want screens to react to stock, time, weather or production status
What live data on screens is used for
| Setting | Typical live content | Common source |
|---|---|---|
| Offices | Company news, events, meeting room availability, visitor welcome, KPIs | SharePoint, Outlook or Google calendars, Power BI, room booking system |
| Manufacturing and logistics | Output against target, line status, safety days, shift messages | MES or ERP via a database or API, Power BI, spreadsheets |
| Contact centres and IT | Queue lengths, waiting times, service status, ticket counts | Telephony and service desk platforms, dashboards |
| Retail | Prices, promotions, stock-driven offers, queue messages | POS, product information or inventory systems |
| Hospitality | Menus and prices, daypart content, events, transport times | POS, events calendars, transit feeds |
| Public spaces and transport | Departures, disruptions, weather, emergency alerts | GTFS-RT or SIRI feeds, weather APIs, alerting systems |
Four ways to connect data to screens
1. Built-in apps and connectors
The easiest route. Most cloud signage platforms ship a library of apps: Power BI and Tableau dashboards, Google Sheets, calendars, RSS, weather, social feeds, and Microsoft 365 content such as SharePoint news. You authenticate once, pick the dashboard or sheet, and place it in a layout. ScreenCloud, for instance, lists native connections to Microsoft Teams, SharePoint, Power BI, Google Workspace and Slack, and OptiSigns offers apps for Power BI, Tableau, Google Calendar and Slack. Check which apps sit in which pricing tier before you plan around them.
The limits: you get the layout the app gives you, refresh intervals are set by the vendor, and a dashboard designed for a laptop is often unreadable on a screen across the room.
2. A spreadsheet or list as the data source
A Google Sheet, Excel file in OneDrive or a SharePoint list sits between the business and the screen. People update a row, and the screen shows it. This is the most underrated pattern in signage: it needs no developer, the people who know the numbers keep them current, and it doubles as a simple content approval step. Many platforms can bind a template to a sheet so that each row becomes a slide or a table on screen. Appspace, for example, can show SharePoint lists, Excel, Google Sheets and JSON feeds as live data cards, and open-source Xibo uses DataSets for the same purpose.
Spreadsheets also make a good landing place for automation: a Power Automate, Zapier or Make flow can write values from another system into the sheet on a schedule, and the screen picks them up.
3. Data-driven templates
Here the design and the data are separated. A designer builds a template once, with placeholders for text, numbers, images and colours, and the platform fills it from a feed. A menu board where prices come from the POS, a production board where the number turns red below target, a welcome screen that shows today’s visitors. This is what makes signage scale: one template, hundreds of screens, no manual edits. Our guide to digital signage templates covers where to find good ones.
4. APIs, webhooks and custom HTML apps
For real-time operational data, you may need to go further: the platform calls an API, or your system pushes updates through a webhook, or a developer builds a small HTML5 app that runs on the player and renders exactly what you want. This gives full control, at the price of code someone has to maintain. Ask the signage vendor for its API documentation and an example of a custom app before committing, and agree who owns the code once it is live.

Content automation: rules and triggers
Live data is about what appears on a slide. Content automation is about which slide plays, when, and where. Common rules:
- Time and daypart: breakfast, lunch and dinner menus, office-hours content versus evening content.
- Location and screen tags: one campaign, filtered per site, floor or screen type.
- Data conditions: show an umbrella offer when it rains, a staffing message when the queue passes a threshold, a promotion only while stock lasts.
- Calendar and booking state: room signs that switch between free and occupied, lobby screens that show today’s events.
- Expiry: content that removes itself after its end date, so nothing stale stays on screen.
- Emergency override: an alert that takes over every screen, triggered manually or by an alerting system, and released again afterwards.
Not every platform supports data-based triggers natively. Where it doesn’t, the spreadsheet pattern works as a workaround: an automation flow changes a value in a sheet, and the template shows or hides content based on it.
Make dashboards readable on a screen
The most common failure with live data isn’t technical. It is a dense Power BI report with twelve visuals and 9-point labels, shown on a screen that people walk past at three metres. Build screen-specific views instead:
- One message per screen: one big number, one trend, one status.
- Large type: as a rough rule, readable text needs about 2.5 cm of letter height per 3 metres of viewing distance.
- Status colours people understand at a glance, with a second cue (icon or label) for colour-blind viewers.
- A visible “updated at” time, so nobody acts on stale numbers.
- Rotate a few views rather than squeezing everything into one.
See our article on digital signage accessibility for contrast and readability guidance.
What IT needs to sort out
- Authentication: use app registrations or service accounts with the narrowest permissions possible, never a person’s login. Watch for connectors that need a password that expires.
- Licensing: some dashboard tools need a paid licence for the account that displays reports, or publish-to-web options that make data public. Check before you show sensitive numbers.
- Data exposure: anything on a screen is visible to visitors and cleaners as well as employees. Keep personal data and confidential financials off public-facing screens.
- Network: players need outbound access to the data sources or to the signage cloud that fetches them. Agree firewall rules and keep players on a separate VLAN.
- Failure behaviour: decide what a screen shows when the feed is down: the last known value with a timestamp, a fallback slide, or nothing. Test it.
- Monitoring: alerts when a feed stops updating, not just when a player goes offline.
Our guides to securing digital signage and signage network planning go deeper on these points.
Choosing a platform for live data
When you compare platforms, ask each vendor to show these live, with your own data where possible:
- Which connectors are included, and in which pricing tier.
- Whether templates can be bound to a sheet, list or JSON feed, and how non-designers edit them.
- How often data refreshes, and whether the refresh happens on the player or in the cloud.
- Whether rules can use data conditions, not just time and location.
- What the API offers, and whether custom HTML apps are supported on your players.
- How the platform authenticates to Microsoft 365, Google and BI tools.
- What happens on screen when a feed fails.
For price comparisons across platforms, see our digital signage software pricing guide, and for internal use cases our internal communications signage guide.
A simple way to start
- Pick one screen and one question it should answer, for example “are we on target today?”
- Find where that number already lives, and whether your platform has a connector for it.
- If not, put it in a spreadsheet that updates automatically or that one person owns.
- Design a screen-specific view with one big number and an “updated at” time.
- Run it for two weeks, ask people whether they look at it, and adjust.
- Only then roll the pattern out to more screens and sites.
FAQ
What is live data for digital signage?
Content that updates automatically from another system, such as a dashboard, spreadsheet, calendar, booking system, POS or public data feed, instead of being edited by hand.
Can digital signage show Power BI dashboards?
Yes, most business signage platforms have a Power BI connector, often on higher tiers. Check how it authenticates and whether the displaying account needs a Power BI licence.
What is content automation in digital signage?
Rules that decide which content plays where and when: by time of day, screen location, calendar state or data conditions such as weather or stock levels, plus automatic expiry and emergency overrides.
Do we need a developer to show live data?
Usually not. Built-in connectors and spreadsheet-driven templates cover most needs. A developer becomes useful for real-time operational systems without a connector, or for custom on-screen apps.
What happens if the data source goes down?
That depends on the platform and how you set it up. Good practice is to show the last known value with a timestamp or a fallback slide, and to get an alert when a feed stops updating.
Bottom line
Live data is what keeps screens worth looking at. Use the connectors your platform already has, let spreadsheets carry the data that has no connector, build screen-specific views, and save custom integrations for real-time operational data. Then make sure someone owns each feed, and that every screen fails gracefully when a source goes quiet. For more on keeping content fresh with a small team, see managing signage content without a design team.